
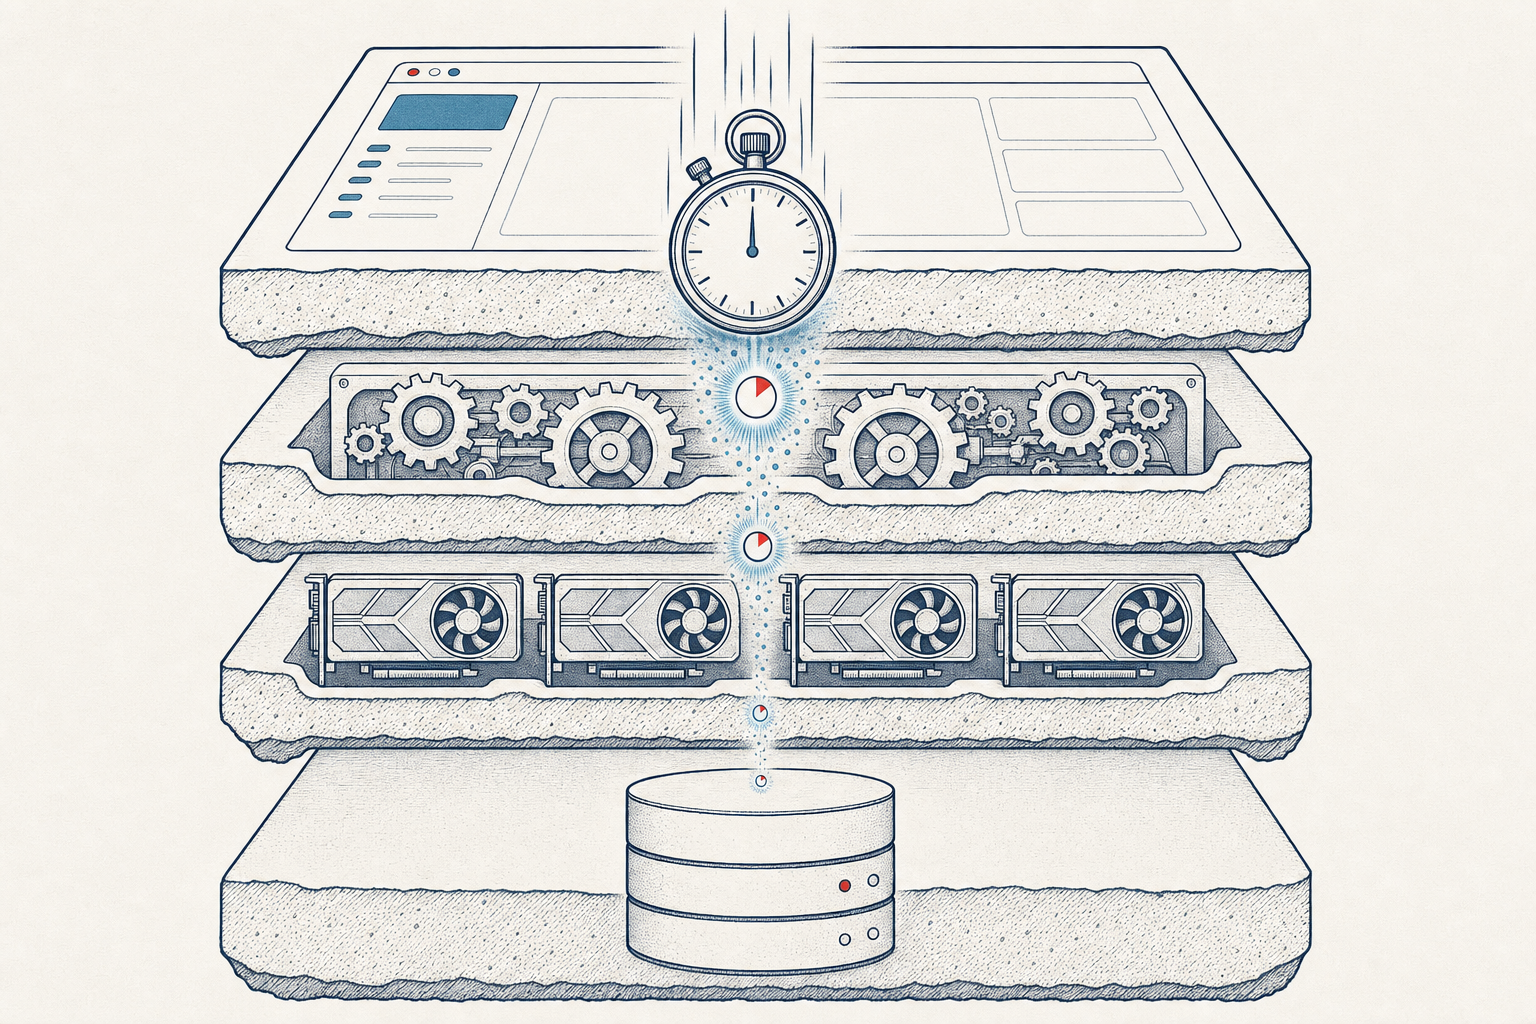
- Writing a one-sentence "situating header" for every chunk before embedding was 97.8% of our RAG ingest pipeline. A full run took 25 minutes; we got it to 57 seconds.
- Lever 1, right-size the model. A 31B model was writing one sentence. The real work was building an eval gate strict enough to prove a 3B replacement held retrieval quality. It did, for roughly a 7.5× win.
- Lever 2, chase the wall clock down the stack. A GPU-utilization monitor, then vLLM's own metrics, then a per-document Postgres commit that left four GPUs idle 27% of the time. More hardware fixes none of it.
- The instructive detour. Raising the prefix-cache hit rate from 0.2% to 84% made the job 2.4× slower. On a memory-bandwidth-bound GPU, that was the wrong number to optimize.
The expensive stage in our retrieval pipeline turned out to be the most boring one. Before any chunk of a document gets embedded, an LLM writes it a one- or two-sentence situating header, such as "This paragraph defines the acceptance criteria for Phase 2 and the penalty that applies if the milestone in Section 4 slips", so the embedding carries document context, not just the bare span. It is Anthropic's contextual-retrieval recipe, and on our document set it works: it measurably lifts recall. It also, per our own profiling, accounts for 97.8% of ingest wall time. Everything else (parsing, chunking, embedding, the database writes) shares the remaining 2.2%.
That single fact framed a two-week sprint. This post is the system-level cut of it: how we took the contextualizer from a production baseline of 25 minutes 29 seconds on a ~700-chunk corpus to 57 seconds, and why almost none of the interesting work was where I expected. The two big levers were independent and worth separating, because they are different kinds of problem:
- The model was too big for the job, a quality-measurement problem. We were running a 31B model to write one sentence. Swapping the model was easy; the work was building an evaluation that would catch a quality regression if the 3B caused one.
- The pipeline was leaving the GPUs idle, a systems problem that lived nowhere near the model. Finding it meant following the wall clock down through the application, the inference engine, the GPU scheduler, and into a Postgres commit.
The method is the one this blog keeps coming back to: measure, don't speculate. Two of the turns below are my own confident guesses, corrected once I measured them.
New here? Six terms before you read on (click to expand)
- Contextualizer / situating header
- A short LLM-generated sentence prepended to each chunk before embedding, describing where the chunk sits in its document. Improves retrieval recall at the cost of one LLM call per chunk.
- vLLM
- Open-source LLM inference server. Handles batching, KV-cache management, and prefix caching. We run one replica per GPU.
- Prefill vs decode
- Two phases of an LLM call. Prefill processes the prompt (compute-bound). Decode generates output tokens one at a time (memory-bandwidth-bound). They have very different cost curves, a distinction that matters a lot below.
- Prefix caching (APC)
- vLLM reuses the KV cache for a shared prompt prefix across calls, skipping prefill for the cached part. Helps prefill; does nothing for decode.
- RRF / hybrid retrieval
- Reciprocal Rank Fusion. Merges dense-vector, BM25, and image-search result lists into one ranking. Our retrieval runs all three lanes.
- NIAH
- "Needle in a haystack." Eval tasks that hide a specific fact in a long document and check whether retrieval finds the right chunk.
- Intra-section confusion
- The fraction of the top-k retrieval results that come from the same section as the top-1 result. It measures whether retrieval can tell chunks apart within a section, not just across documents. Why the threshold matters: a low value means the headers are discriminating fine-grained context; a value drifting up toward 1.0 means "section-block collapse": the headers have gone so generic that a whole clump from one section out-ranks the actually-relevant chunk. We treat ~0.5 as the line: below it, healthy discrimination; above it, the headerizer is too coarse to ship. It's the specific failure a smaller model was most likely to cause, so it's the number the model swap had to clear (it did: 0.18 vs 0.19, max 0.375, well under 0.5).
Part I: Right-sizing the model is a measurement problem
Reaching for the biggest model you have is easy to justify in the moment: it works, it looks fine on inspection, you move on. But a 31B model writing one-sentence headers pays an order of magnitude in latency and VRAM for capability the task may not use. The rule worth holding to: use only as large a model as the task requires, and be able to show where that line is.
That last clause is the hard part. "A 3B model writes fine headers" is an assertion, not a measurement. To make it a decision you can ship, you need an evaluation that fails loudly when a smaller model degrades retrieval. We didn't have one good enough, so before touching the model we spent the first phase hardening the eval gate.
Building an instrument that can fail
The existing gate measured recall@k: is the right chunk somewhere in the top-k? That misses the failure mode a contextualizer swap is most likely to cause: the right chunk is still in the top-8, but it slid from rank 1 to rank 6 because the new headers are slightly less discriminative. So we added graders that can see rank and within-section structure:
| Grader | What it catches that recall@k misses |
|---|---|
mrr_at_k | Rank degradation: the correct chunk demoted within the top-k. |
ndcg_at_k | Quality loss on queries that should surface 2-3 related chunks. |
intra_section_confusion | Section-block collapse: top-k results all bleeding from one section because headers stopped discriminating within a section. |
cite_substance | Whether a cited chunk actually supports the claim (an LLM judge against raw chunk text), not just whether a citation is well-formed. |
The most important design choice was making the substance grader judge against the chunk's raw content, not its generated header. A gold set keyed to whichever model wrote the headers is poisoned by construction: swap the contextualizer and your "ground truth" silently shifts under you. Insulating the grader from the headerizer is what lets you compare two models at all. We also built a stratified within-section NIAH gold set so the gate had needles buried inside long sections, not just section-level questions.
The predicted failure that didn't appear
With the gate built, we ran the first small-model cell. The headline numbers looked alarming, and a pre-flight consensus check with two frontier models (gpt-5.2 and gemini-3-pro) raised a specific, plausible alarm at 8/10 and 9/10 confidence: Header Domination. A smaller model, they reasoned, would emit templated, verbose headers that swamp the 1024-dimension embedding and collapse its ability to tell chunks within a section apart. It is a plausible failure mode, and an easy one to accept without checking, so we treated it as a hypothesis to test rather than a conclusion.
It was wrong, and about ten minutes of diagnostics showed why:
| Metric (29 retrieval tasks) | 31B baseline | 3B-class swap |
|---|---|---|
mean intra_section_confusion | 0.1823 | 0.1875 |
max intra_section_confusion | 0.375 | 0.375 |
| median score-spread (top1 − top8) | 0.0076 | 0.0076 |
Confusion essentially identical, both well under the 0.5 threshold; score spreads identical at the median. The vector-collapse failure mode predicted at 9/10 confidence was not happening on this corpus. The more important finding was upstream. When I audited why the raw pass rates looked so bad, the gold set itself was the problem: 34% of the gold tasks (10 of 29) were failing under both models. Five were stale fixtures pointing at a fake test corpus that had never been ingested. The largest apparent regression, a "5/5 → 0/5" drop on citation-substance, was measured entirely on those non-existent documents, so it was not a real signal.
With the predicted failure ruled out, the decision was straightforward. On the cleaned-up living gold the small model traded a 3-task regression (two of them top-16 near-misses caused by a hybrid-retrieval scoring quirk, not header quality) for a 7.5× throughput win on the first cell. We settled production on Granite 4.1 3B (multilingual including the French and Arabic our corpus actually contains, strong structured output, Apache-2.0), and it cleared the gate. The 31B was more model than the task needed; now we had measured that rather than assumed it.
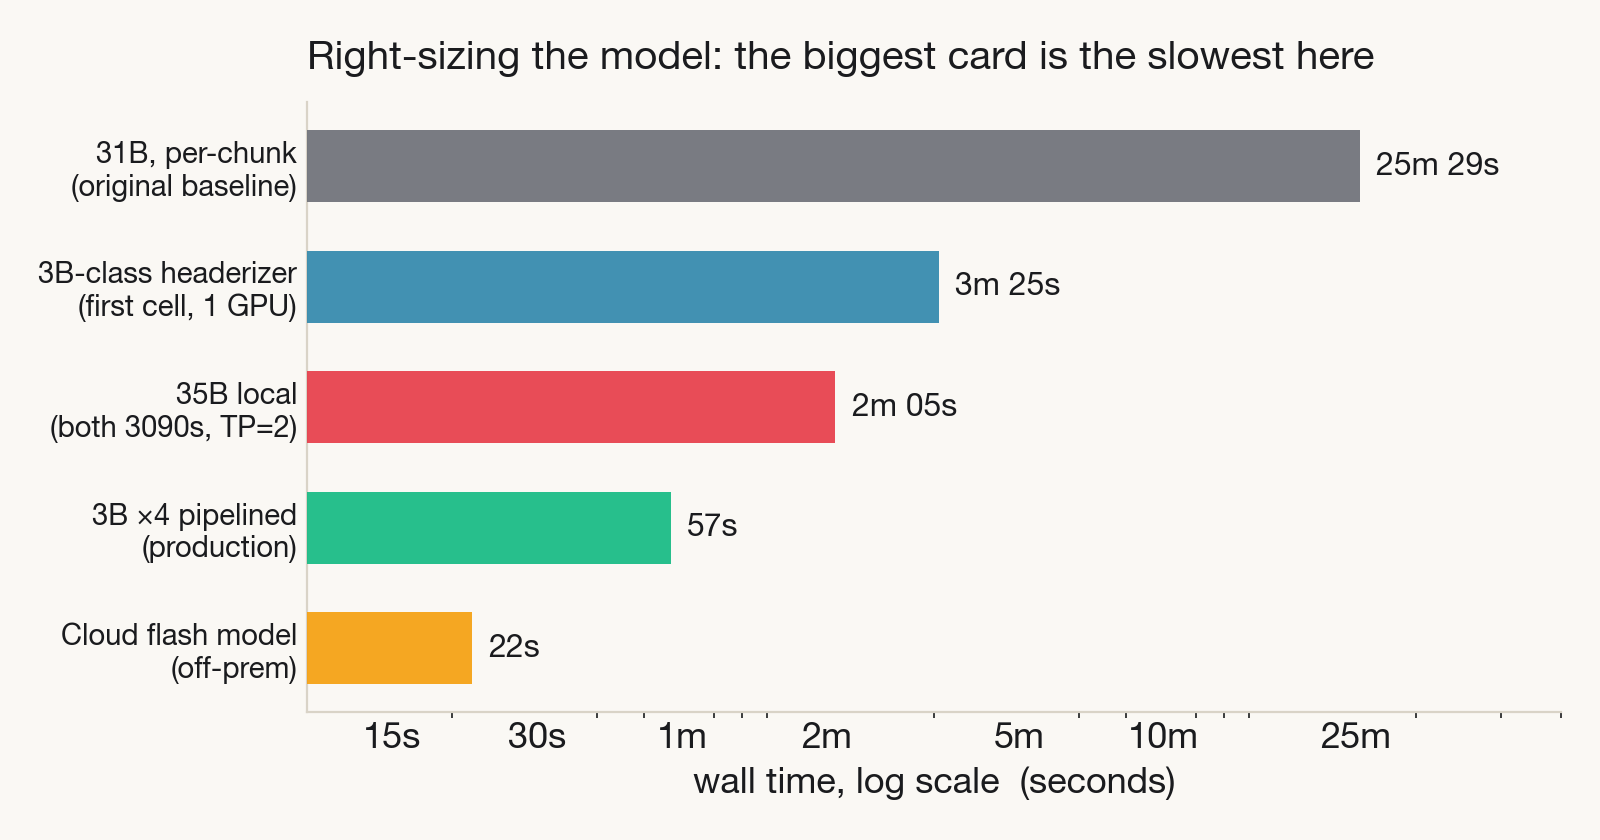
Production baseline   Gemma 4 31B (K=4 batched)    25m 29s
First small-model cell  3B-class headerizer (K=1)    3m 25s   (7.5x)
Part II: Then chase the wall clock down the stack
A 3B model is fast, but we weren't going to run it on one GPU. The homelab has four cards across two hosts, so we stood up four data-parallel Granite replicas, one per GPU, behind a LiteLLM router doing simple shuffle.
| Backend | GPU | Role |
|---|---|---|
| Xeon GPU 0 | RTX 3090 (24 GB) | ctx replica 1 |
| Xeon GPU 1 | RTX 3090 (24 GB) | ctx replica 2 |
| ego-01 GPU 0 | RTX 4060 Ti (16 GB) | ctx replica 3 (cohabits with the embedder) |
| ego-01 GPU 1 | RTX 4060 Ti (16 GB) | ctx replica 4 (cohabits with the embedder) |
Four GPUs, a 64-worker client pool fanning out across them, a fast model. (The config that matters for what follows: Granite 4.1 3B in FP16 with an FP16 KV cache, vLLM with prefix caching on, one replica per GPU, ~16 requests in flight per backend.) The benchmark numbers came back reproducible to ~2% across trials. And it was that reproducibility, not the wall-clock value, that exposed the real problem.
The GPU layer: four cards idle in unison
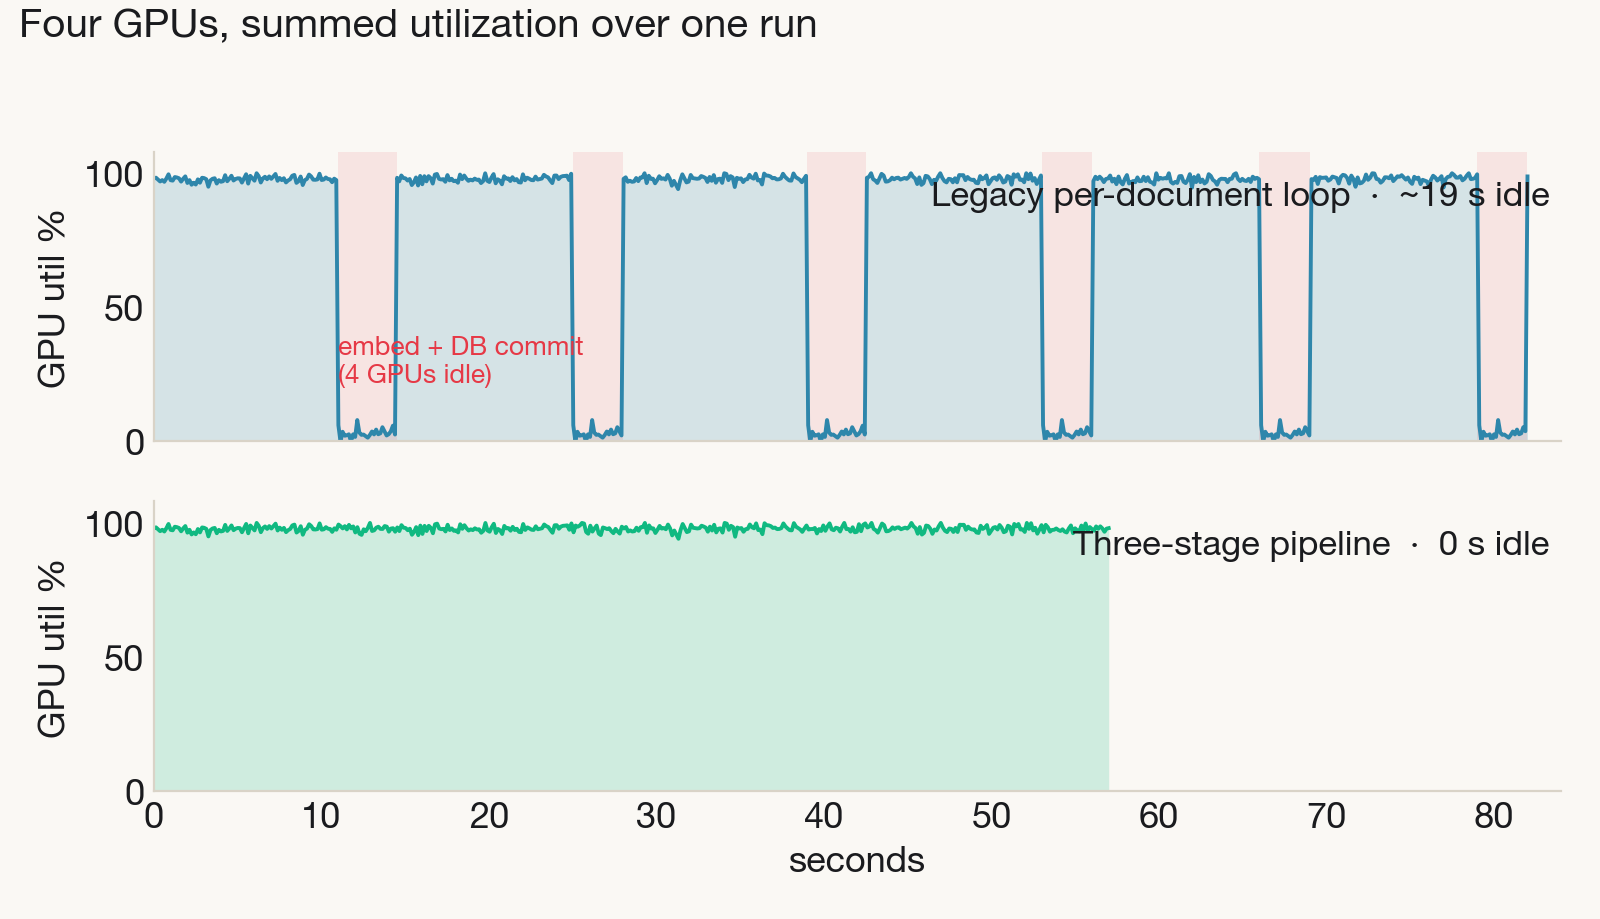
I keep a 1 Hz GPU-utilization monitor running during benches. The time-series didn't look like four independent backends fed by random routing. It looked like a heartbeat: all four GPUs spiking to 100% together, then dropping to 0% together, in synchronized bursts. Independent workers hitting independent backends don't idle in lockstep. Something upstream was gating all of them at the same instant.
The inference-engine layer: per-second token deltas
To confirm it I went one layer down, into vLLM's own metrics. Summing vllm:prompt_tokens_total across the four backends and taking the per-second delta tells you exactly how many prompt tokens the system pushed each second. When contextualization is live the delta is large; when nothing is being fed to the GPUs it drops to ~zero. The pattern was unmistakable and identical across every configuration:
| GPUs | Workers | Wall | Idle barriers | Barrier time | % of wall |
|---|---|---|---|---|---|
| 4 | 32 | 82s | 6 | ~19s | 23% |
| 4 | 48 | 75s | 6 | ~19s | 25% |
| 1 | 32 | 187s | 6 | ~19s | 10% |
| 4 | 64 | 74s | 6 | ~20s | 27% |
Six idle barriers in every single run, totaling 18-21 seconds, regardless of GPU count, worker count, or topology. Five documents in the workload, five inter-document barriers, plus one final flush. That invariance is the signal: a cost that doesn't move when you add GPUs or workers isn't a compute cost.
The data layer: a database commit was stalling four GPUs
The root cause was in the application's own loop, as far from the GPU as you can get while still being in the pipeline. The legacy recontextualize path iterated documents sequentially, and was doc-major within each:
for document in pending:
    with sessionmaker_() as session:
        headers = contextualize_all_chunks(document)   # GPUs busy
        embeddings = embed(headers)                     # GPUs idle
        session.execute(update_all_chunks(...))         # GPUs idle
        session.commit()                                # GPUs idle
    # next doc cannot start until this commit returns
Between every document, the four Granite backends sat idle while the pipeline embedded that document's chunks and ran one big Postgres UPDATE … commit. The barrier length is set by embed latency plus transaction commit, work the contextualizer GPUs play no part in.
Buying a third 3090 here would have wasted money: more GPUs cannot shorten a 19-second barrier that exists because the pipeline stops feeding them.
An instructive detour: the cache-hit metric
Before the barrier was found, an earlier and very reasonable idea attacked the LLM phase head-on. Every contextualizer call sends a long shared body (the surrounding section) plus one short chunk to header. Neighbouring chunks share almost the entire prompt, so if we grouped them into a window of size W that fed vLLM a byte-identical prefix, the engine's prefix cache could skip re-processing that body. It worked, mechanically: sweeping W lifted the prefix-cache hit rate from 0.21% to 83.9%. And wall time got monotonically worse the entire way up.
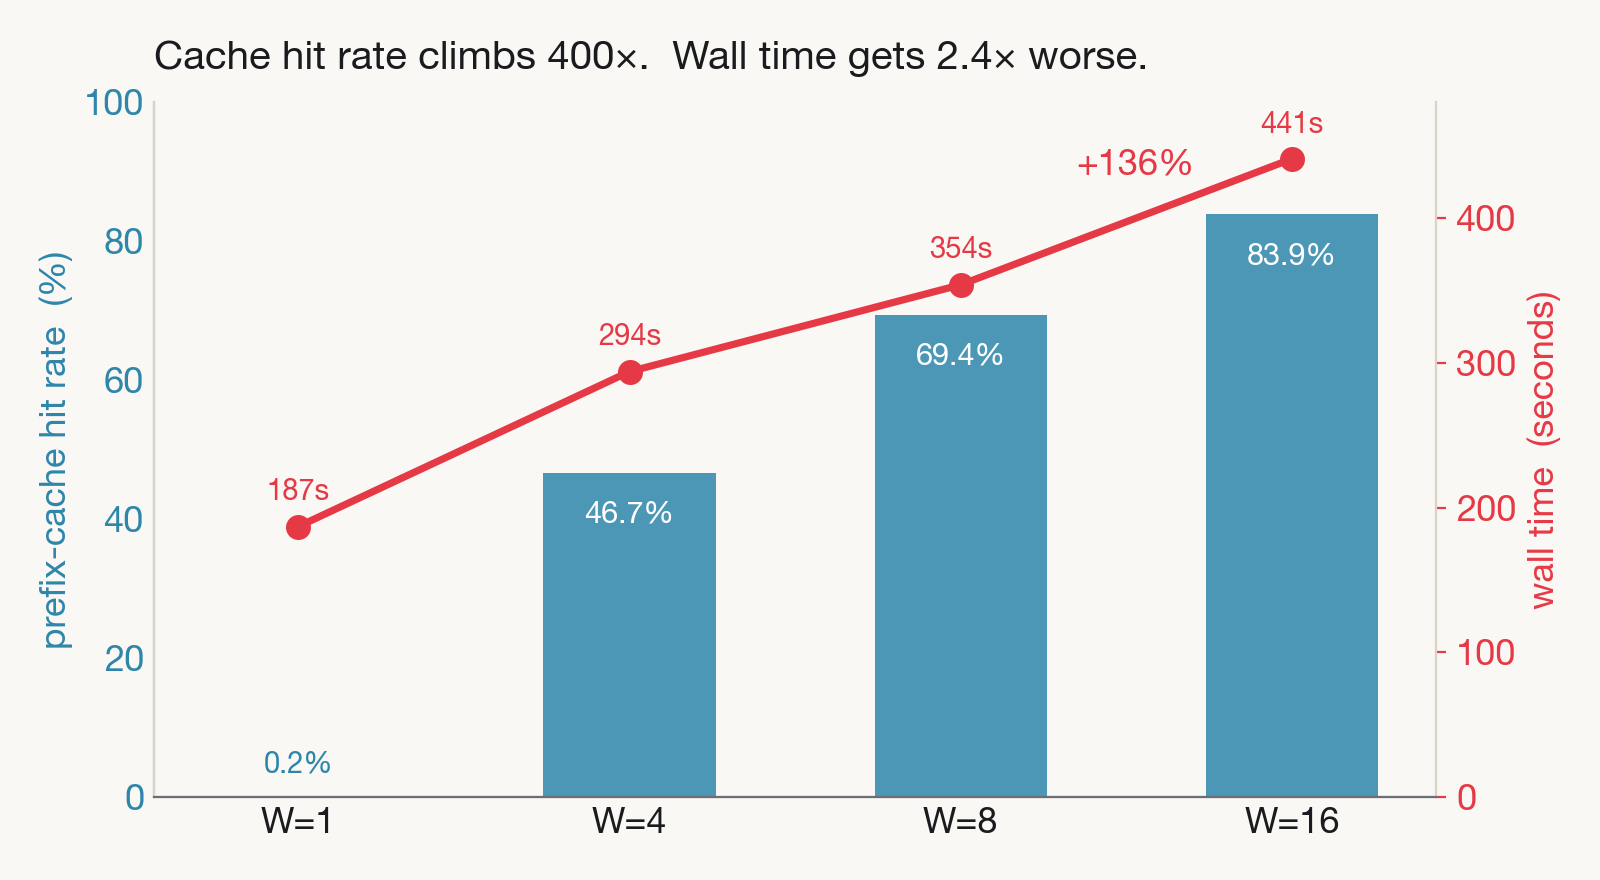
It looks like a paradox until you split an LLM call into its two phases. That split is the most useful model I have for reasoning about inference on memory-constrained hardware, so it is worth being precise about.
Prefill ingests the prompt. In this regime it is compute-bound, a big batched matmul over all prompt tokens, and it is exactly what a prefix-cache hit skips: the cached tokens' key/value vectors are already resident in VRAM, so the GPU does no matmul for them. This is the cost the windowing scheme was so good at eliminating. Decode emits output tokens one at a time, and it behaves very differently. To generate each token, attention must read the key/value vectors for the entire prompt back out of VRAM, and it must do this whether those vectors were freshly prefilled or served warm from the cache. Caching changes who computed the KV; it does nothing about the fact that decode has to read all of it, on every single output token. The per-token matmuls (the MLP and the projections) are a roughly fixed cost, but the attention reads scale with the entire context, O(prompt length) per output token, and on a small model emitting short answers those KV reads are what saturate memory bandwidth.
Now feed the contextualizer's actual shape into that asymmetry, with ~1,000-token prompts producing ~50-token headers:
| Window | Shared prefix | Output tokens | KV-vector reads / call | Prefix-cache hit |
|---|---|---|---|---|
| W=1 | ~1,000 tok | ~50 | ~50,000 | 0.21% |
| W=16 | ~11,000 tok | ~65 | ~715,000 (~14×) | 83.9% |
At W=16 the prefill for that 11,000-token prefix is cached and free, but every one of the ~65 output tokens now drags an 11K-token KV cache out of VRAM, roughly 14× the memory traffic of the W=1 call, to produce the identical one-sentence answer. On an RTX 3090 the ceiling that bites is memory bandwidth (~936 GB/s peak, less sustained in practice), not FLOPs; with the engine decoding a batch of sequences each step against an 11K-token context, the GPU's compute units spend most of every step idle, starved, waiting on KV reads. The high cache hit rate did nothing for the decode phase, which is where the time was going.
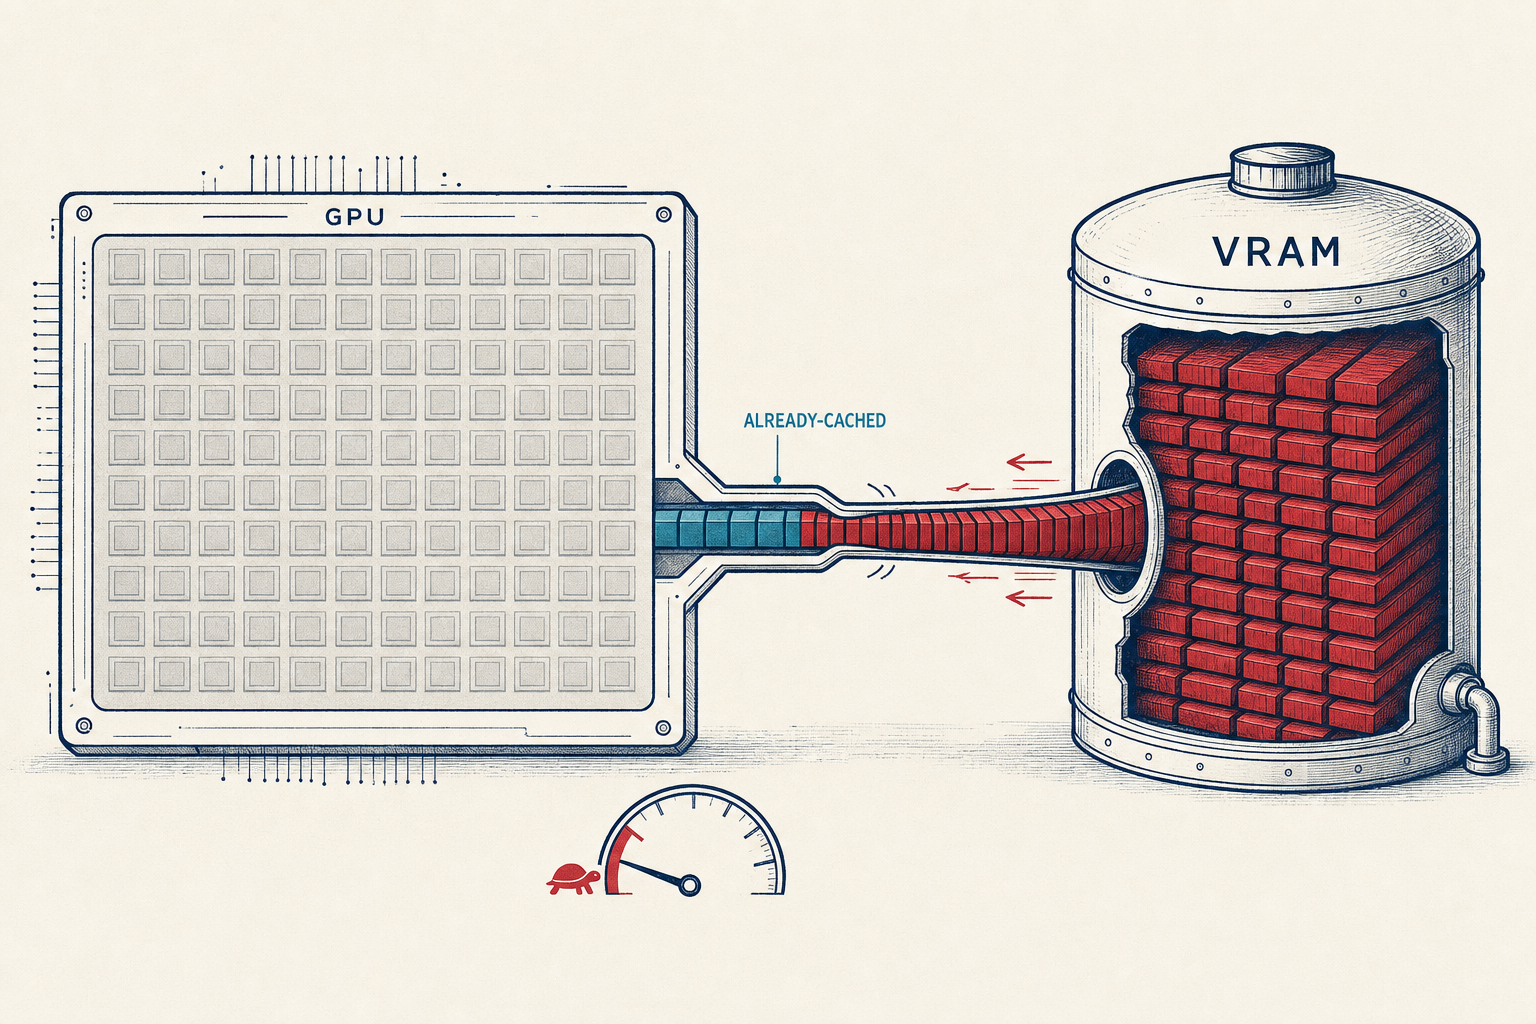
The lesson is narrower than "caching can't help here," and worth stating precisely, because the easy misreading is wrong. Caching the prefill of a prompt you genuinely reuse is a real win. What backfired was manufacturing cache hits by inflating the shared context, lengthening every call's prompt 11× to create a shareable prefix, in a regime where decode, not prefill, was the dominant cost. The prefill we saved was cheap; the decode we added (one full read of that longer context per output token) was not. The mistake was optimizing the hit-rate number instead of measuring where the time actually went. None of this is exotic: for this model's dense attention no vLLM flag changes the decode scaling, though it is not a law of nature either: GQA, sliding-window attention, or an FP8 KV cache would each bend the curve. We reverted the windowing scheme and went looking for the wall clock elsewhere.
Fixing it across the stack
The fix had two stages, and the first one is instructive because it only half-worked. Flattening the pipeline (parse every document, then contextualize all chunks across all documents in one shared fan-out, then embed, then commit per-document) eliminated the idle barriers completely:
But the wall-time win was smaller than the GPU-idle win, and the reason is conservation of work. In the old per-document loop, the parse of document N+1 and the embed of document N were quietly happening during document N's idle barrier, hidden behind time the GPUs were wasting anyway. Flatten the loop and that work doesn't disappear; it moves to the edges of the run, before the first LLM call and after the last, where it's now on the critical path and visible.
So the second stage was a three-stage pipeline: separate thread pools for parse, contextualize, and embed-and-commit, running concurrently so document N+1's parse and document N's write overlap document N's GPU fan-out, putting the edge work back in the shadow of the LLM phase, this time on purpose, while preserving per-document commit isolation.
| Path | Wall | GPU idle | Edge work (wall − LLM phase) |
|---|---|---|---|
| Legacy per-document loop | 82s | ~19s | n/a |
| Flattened across documents | 65s | 0s | 34s |
| Three-stage pipeline | 57s | 0s | 23s |
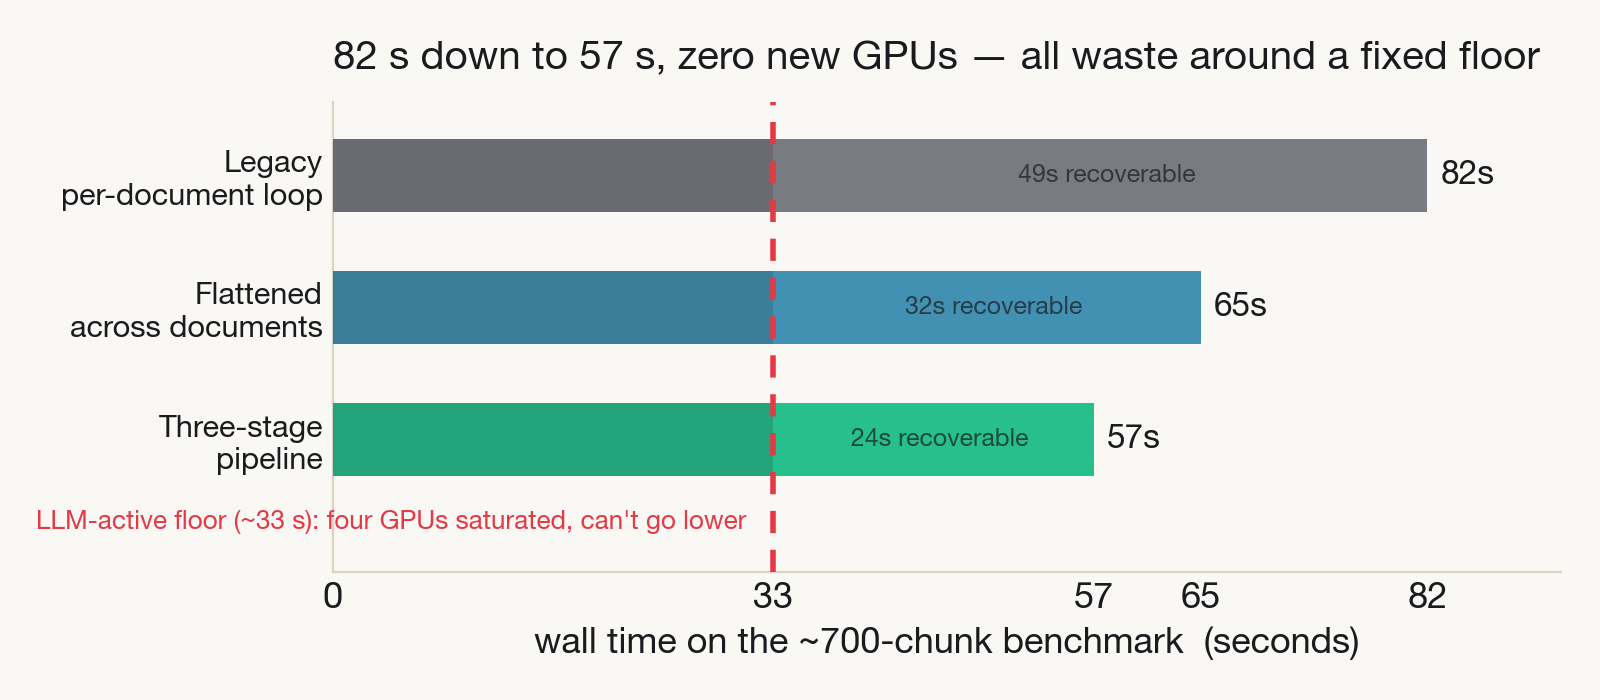
From 82 seconds to 57, about 30%, with zero new hardware. The LLM phase itself, 30-34 seconds of fully-saturated four-way work, can't be made faster without changing the model, the batch shape, or the KV-cache precision: it's the floor for this FP16 config. Everything we recovered was waste around it.
Measuring what I'd assumed: the startup myth
I had been hand-waving that ~10-15 seconds of that wall was process startup the production server amortizes for free. It bothered me that I'd never measured it, so I ran the pipeline three times back-to-back in one process. Startup is paid once at the top; runs 2 and 3 see only per-call work.
| Phase | Measured |
|---|---|
| Python imports + router + DB engine init | 2.14s |
| Run 1 (Python warm, vLLM cold) | 57.8s |
| Runs 2-3 (everything warm) | 53.7s |
Startup was 2.14 seconds, not 10-15, off by an order of magnitude. The CLI is a thin HTTP orchestrator; the heavy model lives in the vLLM containers, not in this process, so there's nothing big to warm. vLLM's own cold-start adds ~4 seconds on the first call after a restart. Total amortizable: about 6 seconds, and the production wall on the long-lived server is ~53-54s, not the ~42-47s I'd projected before measuring. A real win, four seconds and not fifteen, but mostly a reminder that "the server amortizes it" is a claim, not a measurement, until you've timed it.
Same runner, different engine: cloud and a bigger local model
With the pipeline fixed, the same harness made it cheap to ask a question I get asked constantly: would a cloud model, or a bigger local one, be better? I pointed the identical pipeline at two other backends.
The cloud model was 2.6× faster: its concurrency sits well above our four-GPU saturation ceiling. Two details matter. First, its prompt cache hit 94.8% on repeat trials and the wall barely moved: the cache cut input cost, not the wall. It is the same prefill-vs-decode split as the vanity-metric story, one layer up. A prompt-cache hit skips prefill, but the wall is set by decode plus the provider's own scheduling (time-to-first-token and throughput-oriented batching that optimizes for their fleet, not your latency), none of which a cache hit touches. Second, the trade is data residency: that text leaves the building, which for a private or regulated document set is a real constraint, not a footnote.
The bigger local model was the more pointed result. Qwen 3.6 35B-A3B, fully saturating both 3090s, ran the same job 2.2× slower than four small replicas, at 6K tok/s against the 3B fleet's 20K. Pushing its concurrency higher OOM'd with 33 MiB free on a 24 GB card, and not on the KV cache (vLLM reported plenty of KV budget) but on the scratch tensors of its Gated DeltaNet layers, the linear-attention half of this hybrid linear-plus-full-attention MoE. This is Part I's point from the other direction: for this job on this hardware, the bigger local model is not just unnecessary, it is slower. Right-sizing down was the faster option, not a compromise.
Two more places the data corrected the story
This kind of work generates wrong intermediate conclusions, and the discipline is to let the next measurement overturn the last one.
The "the 4060 Tis are net-zero" mistake. Early on I'd concluded the two ego-01 cards added only ~6%, barely worth the cohabitation hassle. That number was an artifact: the fixed 19-second barrier was inflating every wall time equally and masking each card's real contribution. Subtract the barrier and the 3090s are 29% faster per-GPU than the 4060 Tis (not 9%), the 4060 Tis pull a genuine ~3.87 chunks/sec each, and the four-way fleet hits 18.8 chunks/sec, within noise of its 17.7 theoretical ceiling. The cards were pulling their weight the whole time; the barrier was hiding it.
The clock that ate a trial. Mid-sprint, one benchmark reported a 492-second wall. The Xeon's clock had been free-drifting (its configured NTP server had quietly stopped resolving) and chrony stepped it forward 435 seconds in the middle of that trial's measurement window. Real wall was ~57s; the other 435 were a clock jump. Every bench script now gates on chronyc tracking | grep "Leap status: Normal" before the first trial. Your stopwatch is part of the system under test.
What I'd take to the next system
Caveats: what this isn't
This is one corpus (~700 chunks of long-form, heavily-structured documents), one heterogeneous four-GPU homelab topology, and a five-document benchmark workload. The ~25× headline is three compounding levers, not one: right-sizing the model (~7.5× on a single GPU), fanning it out across four GPUs, and the pipeline rework (the clean 82→57s same-workload bench). All three were measured on overlapping but not byte-identical workloads, which is why I've kept them separate above rather than combining them into one tidy multiplier. Retrieval quality held the gate (within one task of the 31B baseline on living gold), but quality parity on a single corpus is not a general claim that 3B headers equal 31B headers everywhere. It's a claim that for this task, measured this way, the smaller model was sufficient, which is the entire point. Your prompt regime, output lengths, and hardware will move every one of these numbers.
What's next
The remaining floor is the ~30 seconds of saturated LLM work plus ~20 seconds of per-document edge work that can't be hidden behind it, and neither is truly fixed. Because the LLM phase is memory-bandwidth-bound, an FP8 KV cache roughly halves the traffic decode is bound by and is the obvious next experiment for lowering the floor on the same cards, gated, as always, behind the eval. The edge work, meanwhile, shrinks with larger batches, not faster cards or a daemon, so the other lever is batch sizing under the gate, watching for the structured-output degradation small models show when asked for too many headers in one JSON response. And the cloud result keeps a question open that no benchmark settles: where a data-residency line sits relative to 2.6× wall and near-zero marginal cost. That one isn't a measurement. It's a decision.