
I thought compilation had nearly quadrupled the sequentiality of one model's GPU memory stream. The number was 15.90. It was clean, repeatable, and supported by ten million memory requests.
It was also based on the first 2.13% of the decode step.
When I processed the complete stream, 15.90 became 7.79. The Llama TensorRT-LLM INT4 engine moved further: 10.81 became 3.37, almost back to eager Llama execution. Nothing about the model, GPU, cache filter, or full-step hardware-counter totals had changed. I had measured the beginning accurately and mistaken it for the whole.
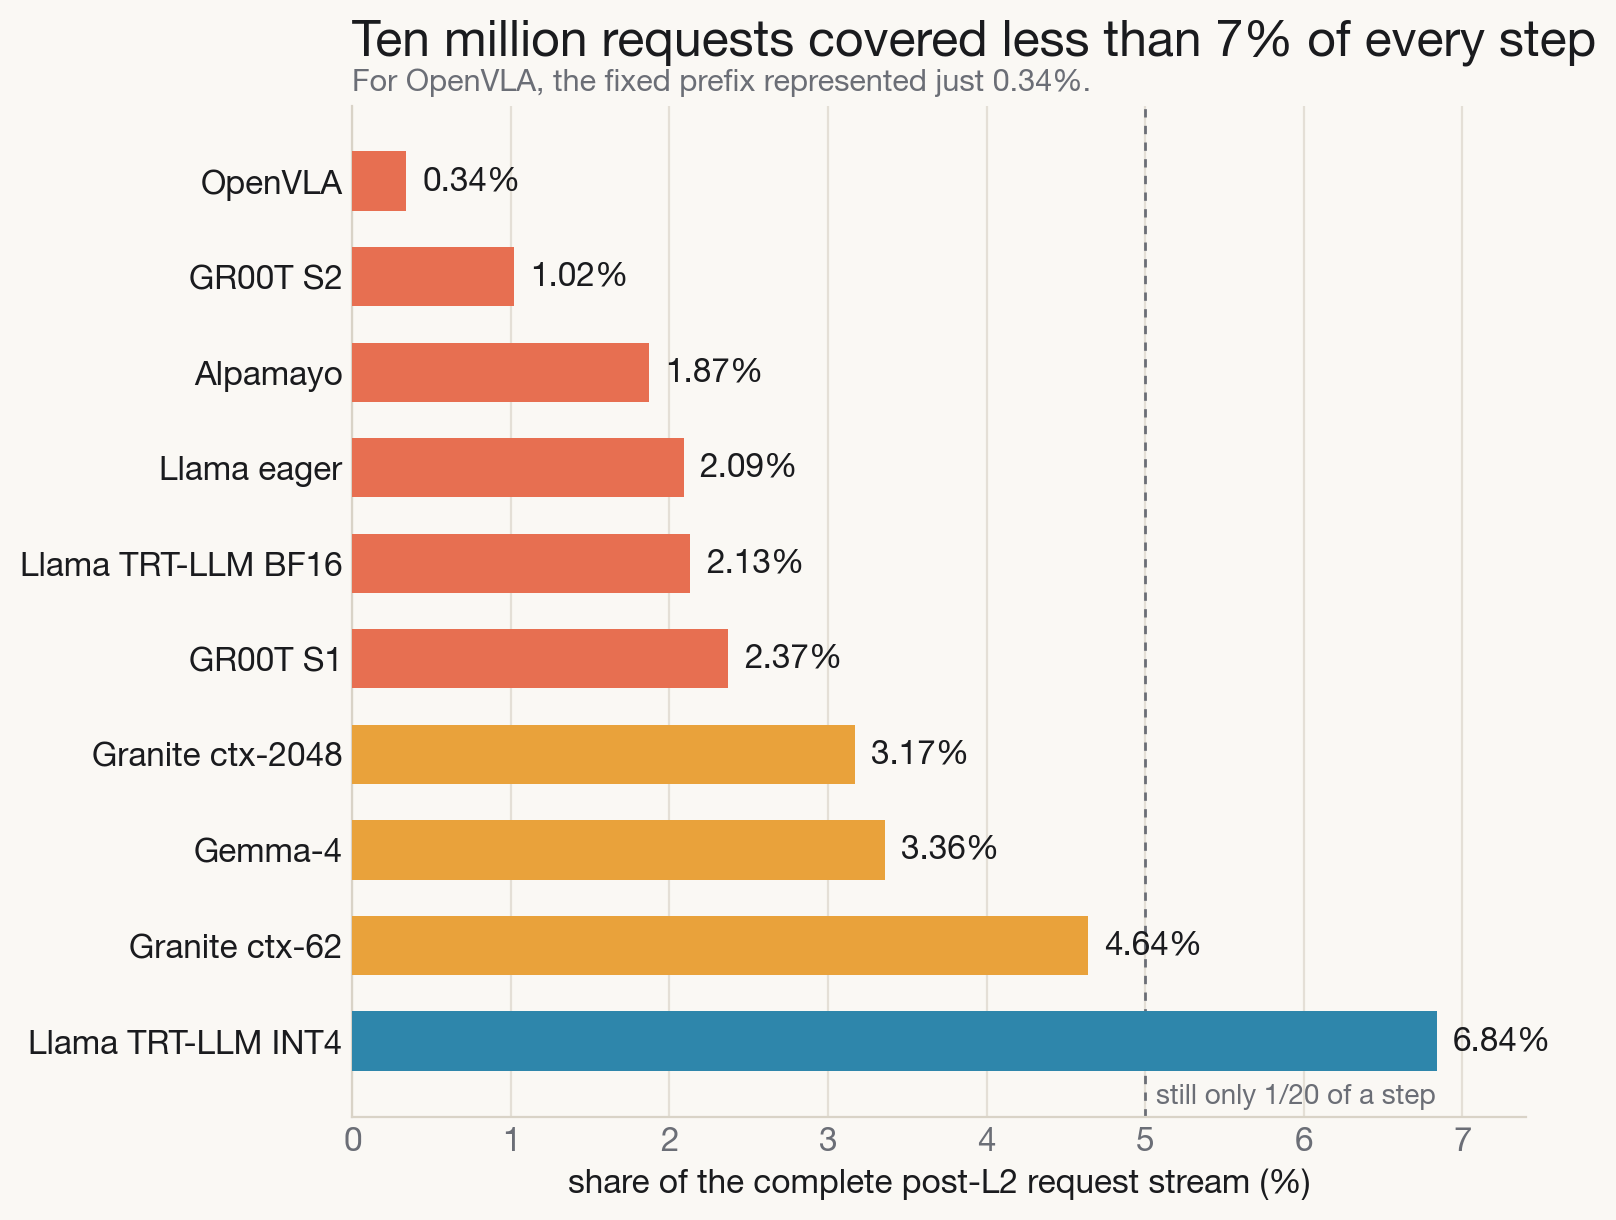
- A fixed first-10-million-request sample represented only 0.34%–6.84% of the complete post-L2 streams across ten workloads.
- The bias was positional, not merely “too small.” It favored the early GEMM-heavy region and missed late phases such as the unquantized
lm_head. - Matched BF16 compilation still improved whole-step run locality by 2.44× (3.19 → 7.79). The original “nearly 4×” number was true only inside the early GEMM-dominant region.
- All hardware-counter totals and quantization's 3.22× read-volume reduction remain unchanged. The correction is to descriptive address-distribution claims, not to the measured byte totals.
- The practical rule: if execution has phases, a first-N prefix is a position, not a sample.
Four terms used below
- GA102 (RTX 3090)
- The GPU used as the capture vehicle in this experiment. “GA102” names the NVIDIA GPU die; the card on the rig is an RTX 3090.
- Llama TensorRT-LLM
- A compiled Llama-3.1-8B engine built with NVIDIA TensorRT-LLM.
- Post-L2 request stream
- The 32-byte sector addresses that the replay model sends toward device memory after applying its cache model to captured SM-side requests. It is a modeled boundary, not a native DRAM command trace.
- effR
- Effective consecutive run length: accesses divided by maximal +32-byte sequential runs, broken by an address discontinuity or read/write turnaround. Higher means longer consecutive runs. It is a descriptive address-stream statistic, not the DRAM's measured row-hit rate.
The number that looked like a conclusion
The experiment began as a determinism ladder. I ran the same Llama-3.1-8B decode step three ways on the same GA102 (RTX 3090): eager BF16, a compiled Llama TensorRT-LLM BF16 engine, and a compiled Llama TensorRT-LLM INT4-AWQ engine. CUDA graphs were disabled for instrumentation. The compiled engines reduced the launch population from 1,563 to 273 and 305, and their kernel schedules repeated exactly across captures.
The first address-level result looked wonderfully legible:
first 10M effR
first 10M effR
first 10M effR
That shape fit the software story. Compilation fused work into a compact engine plan and produced long regular address runs. INT4 changed the kernels and phase texture. The traces were deterministic across repeated captures. The numbers even passed the preregistered calibration-versus-held-prefix stationarity gate.
The mistake was subtler than a broken counter. The gate answered whether two halves of the same early prefix agreed. It did not answer whether that prefix represented the entire decode step.
The first 10 million was a compute budget, not a sampling design
Ten million records was a practical early choice. It was large enough to expose repeatable phase structure and cheap enough to run repeatedly while the tracing and replay machinery was still changing. The dangerous step came later: I let “large” become a synonym for “representative.”
The complete recuts made the denominator visible. Ten million requests covered less than seven percent of every step, and less than three percent of six of them. For OpenVLA, it covered 0.34%. For eager Llama it covered 2.09%; for Llama TensorRT-LLM BF16, 2.13%.
Workloads in this study
The roster deliberately spans language generation, autonomous driving, and robot-control workloads. Multiple rows from one model family represent different execution configurations or stages.
| Model family | What it does | What was measured |
|---|---|---|
| Granite | Language-model inference | ctx-62 and ctx-2048 decode windows |
| Llama 3.1 8B | Language-model inference | Eager execution, Llama TensorRT-LLM BF16, and Llama TensorRT-LLM INT4-AWQ |
| Gemma-4 E4B | Language-model inference | One decode-step window |
| OpenVLA | Vision-language robot control | Action-generation window |
| Alpamayo | Autonomous-driving reasoning | Reasoning decode window |
| GR00T | Vision-language-action robot policy | S1: diffusion-transformer action-head denoising. S2: vision-language backbone forward pass used for reasoning. |
(RTX 3090)same workload execution
This distinction matters because neural-network execution is ordered. A decoder does not draw kernels independently from a bag. It walks through phases: attention, projections, copies, output heads, sometimes image towers or action heads. A prefix has a fixed position inside that schedule. Adding more records only makes that position more precisely measured.
The complete streams changed the locality story
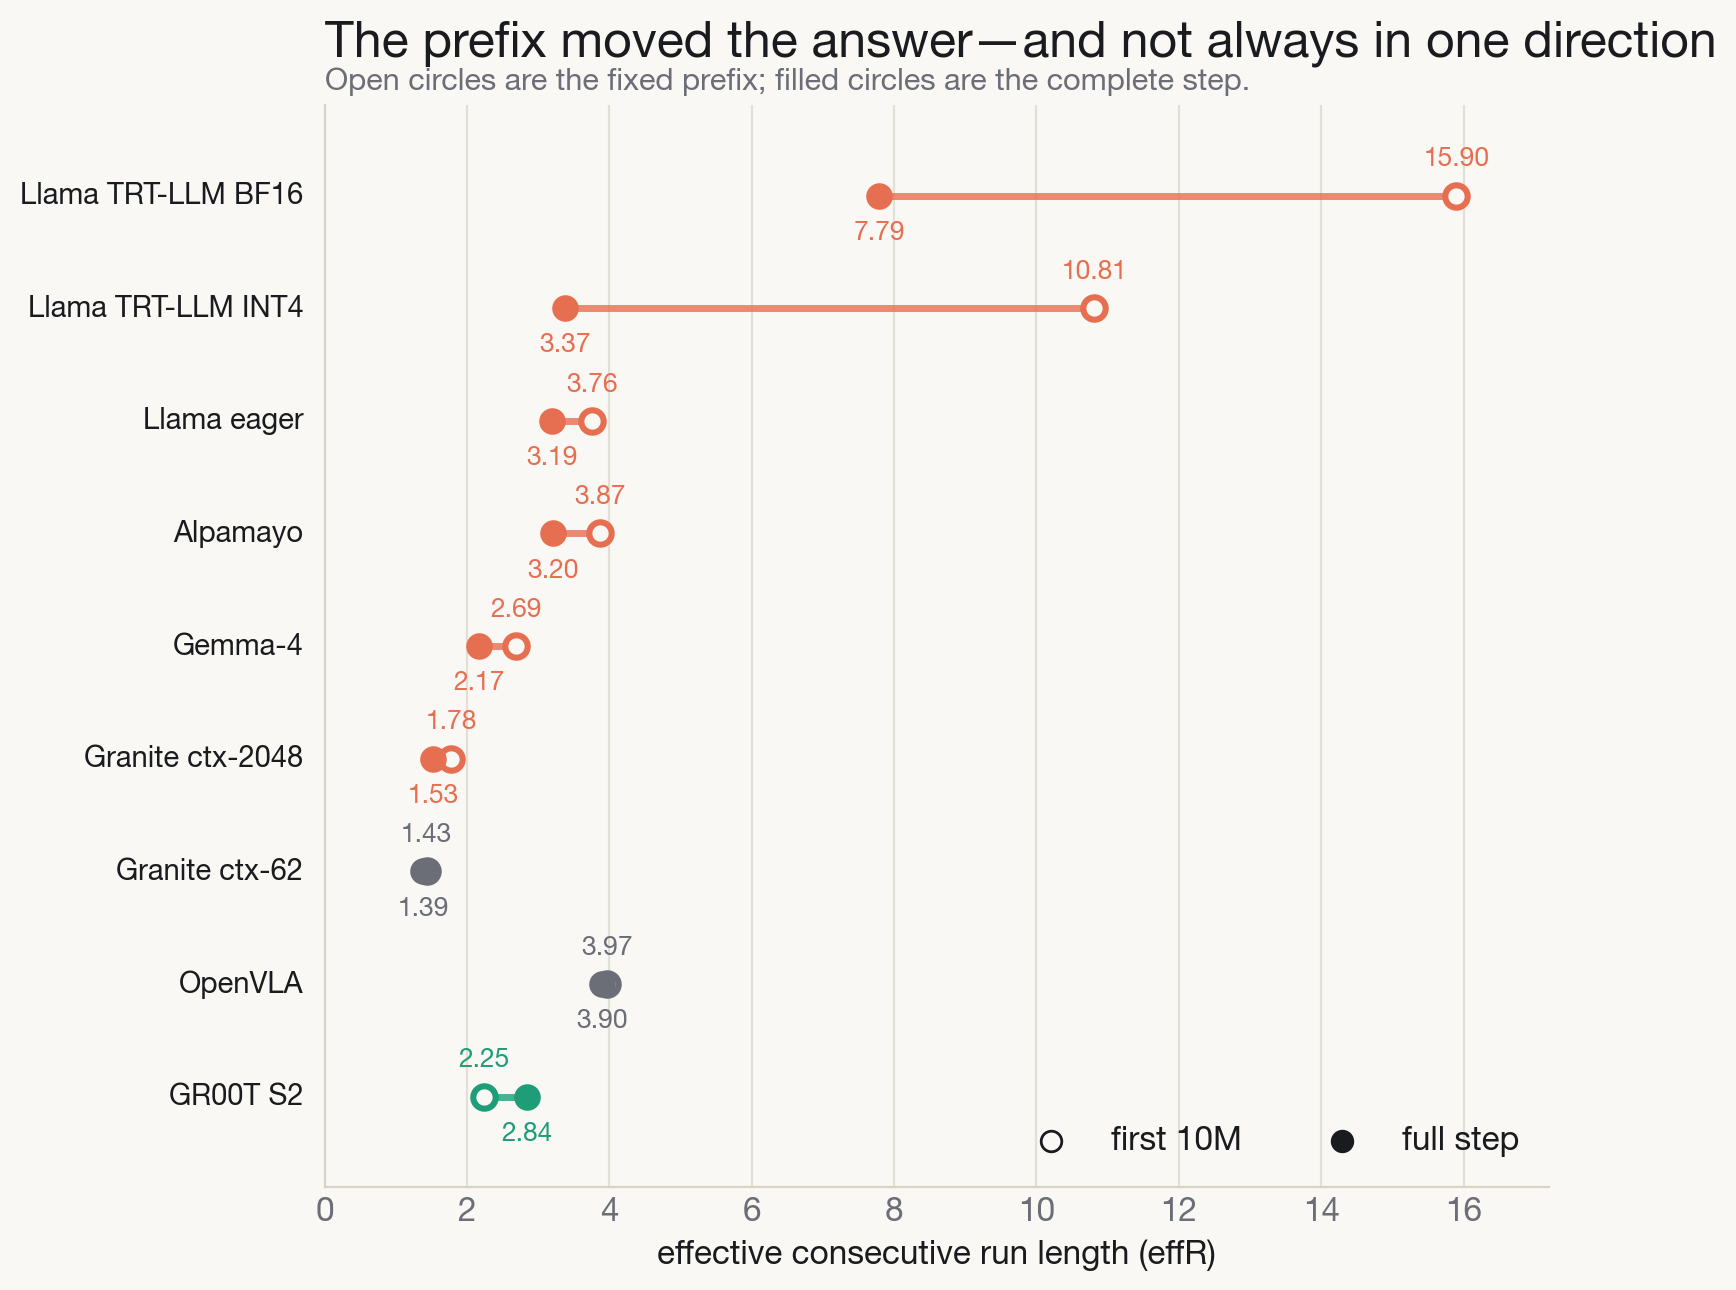
Across the roster, the prefix usually overstated effective run length. The compiled Llama legs moved the most: BF16 fell from 15.90 to 7.79, while INT4-AWQ fell from 10.81 to 3.37. Eager Llama moved from 3.76 to 3.19. Gemma, Alpamayo, and Granite ctx-2048 all moved downward too.
But this was not a universal “prefixes are optimistic” rule. The GR00T S2 reasoning stage moved in the opposite direction, from 2.25 to 2.84, because its write-heavy back half was under-represented in the prefix. OpenVLA barely moved at all, from 3.97 to 3.90, and became the clean control: its body really was phase-homogeneous at the scale this statistic could see.
The missing phase was sitting at the end
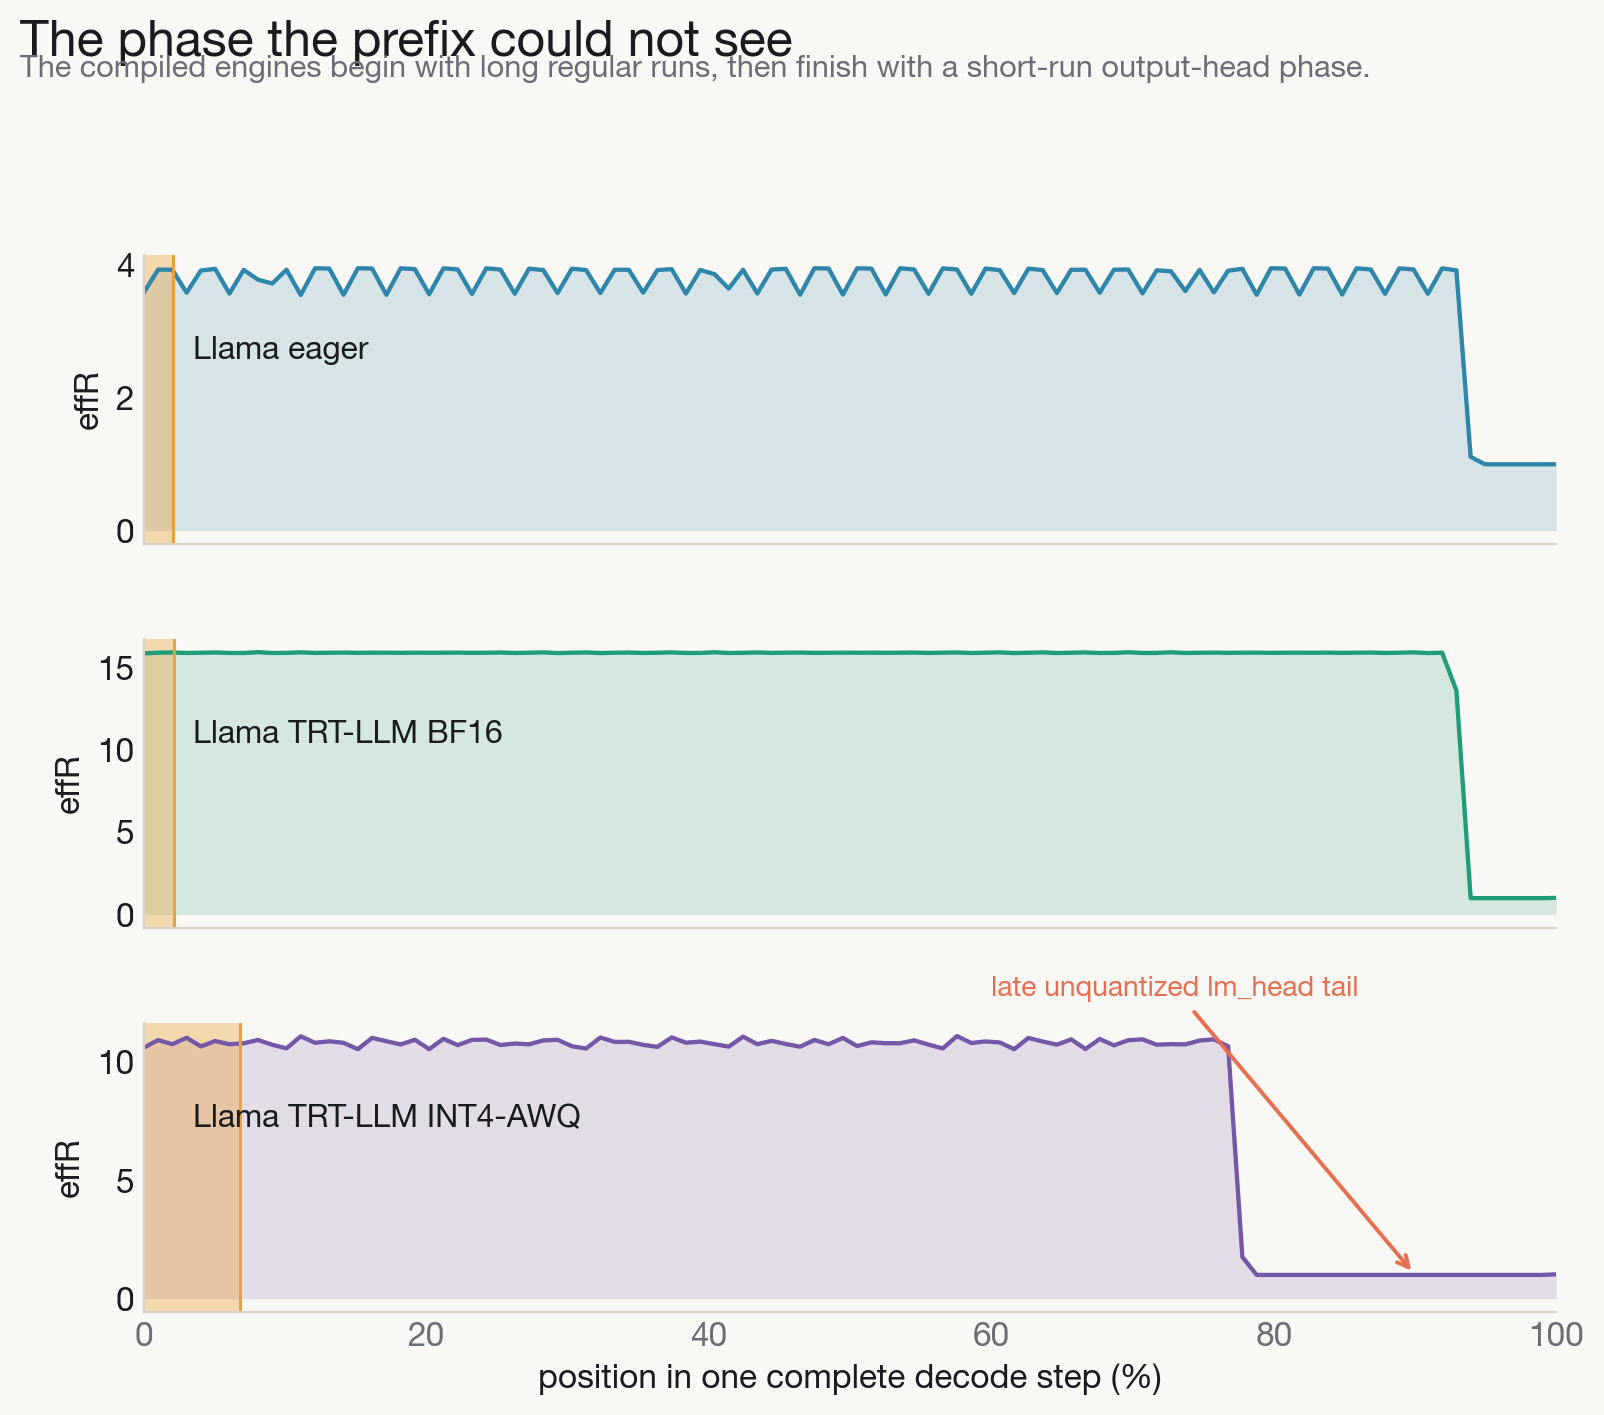
The Llama mechanism is visible without a statistical model. Eager execution spends most of the step near four-sector runs, then drops into a short-run tail. The compiled BF16 engine holds a plateau near sixteen sectors for most of the step. The compiled INT4-AWQ engine holds a plateau near eleven. Then both encounter a late output-head phase.
That tail is the unquantized lm_head: the final projection from hidden state to vocabulary logits. It contributes about 7.0% of BF16 bytes and 22.5% of INT4-AWQ bytes. As the INT4 engine shrank the quantized backbone, the unquantized tail's share grew from marginal to 22.5% of all bytes. A 10M prefix at the start of the step could not possibly observe it.
The corrected whole-step comparison is still interesting, just less theatrical. Matched BF16 compilation increases effR from 3.19 to 7.79, a 2.44× gain. That is a substantial software-stack effect on memory-request shape. It is not the nearly 4× claim implied by the early region.
The INT4 result is sharper. Full-step hardware counters measured device reads falling from 15.044 GB to 4.671 GB per step, a 3.22× reduction. But its whole-step effR returned to 3.37, nearly eager's 3.19, because the output head did not shrink with the backbone. Quantization improved volume while exposing a different locality bottleneck. “Less traffic” and “more sequential traffic” were never the same claim.
What the correction changed and what it did not
Changed
- Whole-step effR values and row-hit-floor descriptions
- The “compilation nearly quadruples run length” framing
- Any implication that the compiled step was phase-homogeneous
- The magnitude of downstream window-based memory-replay comparisons
Unchanged
- Full-step hardware-counter byte totals
- Compilation's deterministic kernel plan under the fixed contract
- The 3.22× INT4 read-volume reduction
- The original 10M fit/validation record, still valid at prefix scope
This is the part of correction work that is easiest to mishandle. Discovering a sampling flaw does not license throwing away every result from the campaign. It requires tracing each claim back to the quantity that supported it. Hardware counters covered the complete profiled step, so those totals stand. The prefix statistics described the prefix, so they keep that scope. The correction is not “the experiment was wrong.” It is “one descriptive statistic escaped its denominator.”
The checks I would require now
- Record the denominator. Every prefix artifact should state both its record count and its percentage of the complete execution.
- Plot position before averaging. A hundred normalized windows across the full step expose phase cliffs that a single aggregate hides.
- Keep one stable and one opposite-direction control. They prevent a convenient global correction factor.
- Separate measured totals from descriptive address statistics. A sampling correction to effR says nothing by itself about a full-step hardware byte counter.
- Scope formal gates exactly. The 10M stationarity tests remain legitimate prefix tests. They do not become whole-step tests because the prefix happened to be repeatable.
The larger lesson is about phases, not prefixes
The first ten million requests were not useless. They helped build the tracer, expose repeatable kernel states, and preregister tests that could fail. Their failure came from a promotion: a development window quietly became a description of the workload.
Full-stream processing did not merely produce better averages. It showed why summary-statistic traffic generators kept failing later validation. The missing information was not another marginal histogram. It was sequence: which phase appears when, how long it lasts, and what follows it. A synthetic generator faithful enough to reconstruct that order begins to look like compressed replay of the trace itself.
That leads to the next boundary. Even the complete post-L2 stream is not “the workload.” It still carries the kernel choices, memory layouts, allocator behavior, and library dispatch of the capture stack. A full trace fixes the sampling problem. It does not make the trace portable.
The trace is not the workload
What survives when a GPU trace crosses a platform boundary, and what the capture stack has already baked in before replay begins.
Caveats
- The locality results are from one fixed prompt and decode-step contract per leg, not a distribution over user inputs.
- CUDA graphs were disabled on the Llama TensorRT-LLM legs so launch events remained visible to the tracer.
effRis computed from the modeled post-L2 sector stream. It is not a direct hardware cache or DRAM-row measurement.- The compiled-engine comparison is same model and GPU, but TensorRT-LLM changes kernel selection, layouts, and execution schedule by design.