
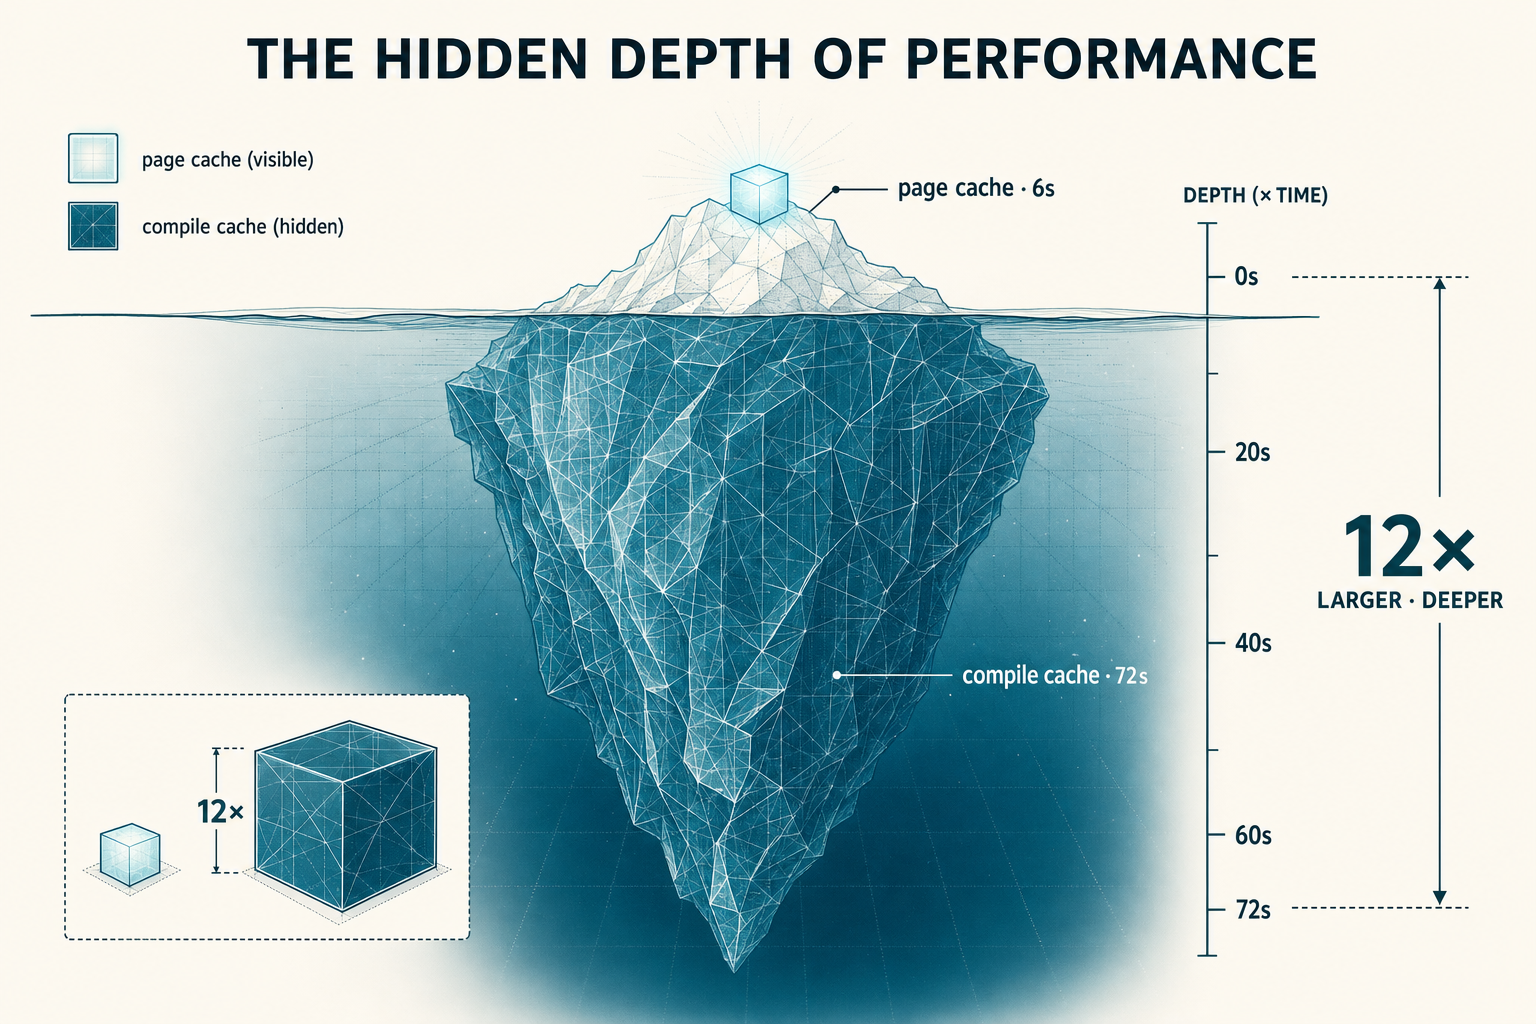
Page cache costs 6 seconds. Compile cache costs 72.
I went into this experiment expecting IO to be the dominant factor, because the weights are 41 GB. On any other workload that size, fast NVMe and a warm page cache would carry the boot floor. Eight measurement cells later, neither did. The seconds actually live somewhere most storage architects don't think to look. The same hardware also gave up 36% of its power draw for an 11% throughput cost when I asked nicely.
This post is the storage-and-power cut of a longer investigation into LLM serving on two consumer GPUs. The narrative is shaped for SREs, infra engineers, and anyone trying to spec storage and power for inference fleets without overpaying.
New to LLM serving? Six terms to know before you read on (click to expand)
- vLLM
- Open-source inference server for LLMs. Handles batching, KV cache management, and the kernel/graph plumbing you don't want to build yourself. Used throughout this post.
- Speculative decoding (MTP)
- A throughput optimization where a smaller "drafter" model proposes several tokens that the main model verifies in parallel. Trades extra cold-start cost (compile + warmup) for higher steady-state token generation. The ~75 s tax in this post comes from MTP-style speculative decoding.
- TTFT — time to first token
- The latency from when a request hits the server to when the first response token is returned. Distinct from boot time: TTFT is a per-request metric, boot time is a per-process metric. They have different bottlenecks.
- The three compile caches
torch.compile(PyTorch's graph compiler), Triton (the kernel autotune layer), and CUDA-JIT (NVIDIA's runtime kernel compilation). Each one builds artifacts the first time it runs and caches them under~/.cache/. Persisting these is the biggest storage-side win in this post.- GPTQ-Int4 / AutoRound
- Two different methods for quantizing LLM weights to 4-bit integers (instead of the original 16-bit floats). Quantization shrinks memory footprint and increases throughput, but the two methods route through different GPU kernel paths (e.g., Marlin kernels for GPTQ) with different compile profiles.
- KV cache
- The memory used to hold attention keys and values during generation. Scales linearly with context length and active request count, and is often the bottleneck on what context length you can run. Not the same thing as the page cache or the compile cache; different memory entirely.
Three assumptions the measurement didn't support
So what's left?
The 8-cell sweep
Three models (Gemma 27B, Qwen3.6-27B, Qwen2.5-72B-GPTQ-Int4), cold and hot variants, all on vLLM nightly with TP=2 across two RTX 3090s. Eight cells total, deterministic per engine config.


Two observations fell out of the sweep:
Page cache contributes 6-65 seconds depending on the model. The Qwen delta was 6 s, the Gemma delta was 65 s. Same hardware, same OS, same Linux page cache. Different file structure (Qwen ships fewer, larger weight files; Gemma ships many smaller files), which interacts differently with readahead.
NVMe throughput peaks at 1.3 GB/s. The loader issues sequential reads but doesn't parallelize aggressively enough to push the drive. 41.6 GB at 1.5 GB/s gives you the 27 s of pure-IO load time you'd predict, which is a small fraction of the 191 s boot floor.
So where do the seconds actually live?
I ran a targeted experiment to find out. Same model (27B), same flags. Hot page cache: all weight files cached in RAM from a prior load. Then wipe the three compile cache directories (torch.compile cache, Triton autotune cache, CUDA-JIT cache) before booting. The page cache stays hot; the compile cache is cold.
The result that matters for storage architects. On this workload, the three compile caches (torch.compile + Triton + CUDA-JIT) contribute 12× more cold-start time than the Linux page cache. The thing your storage instincts are tuned to optimize (page cache) is the smaller contributor. What actually controls the seconds is software state in ~/.cache/, not data movement from disk.
These two caches live in different places and need different infrastructure. The page cache lives in RAM and gets evicted under memory pressure. The compile cache lives on disk under ~/.cache/, but it's brittle: a single bump to the driver, CUDA, Triton, or vLLM version invalidates it. At fleet scale, faster NVMe doesn't fix cold-starts. Persisting the compile cache across pod rotations does (mechanics in Takeaway 3).
Measured deltas, not a strict additive decomposition
Here is what was actually measured. These aren't independent line items you can sum to a total; they're deltas from different baselines on different timers.
| Mechanism | Incremental cost | Notes |
|---|---|---|
| Hot baseline · spec ON · all caches warm | 189.5 s | Deterministic across 3 runs. Already contains the speculative decoder's boot-time compile cost (~40 s of this is spec-decode setup). |
| Page cache miss · delta vs hot | +6 s | NVMe throughput, weight file structure. The disk-side contribution. |
| Compile cache miss · Cell A delta vs hot | +72.5 s | The three compile-cache dirs wiped. Includes the speculative-decoder compile branch being re-triggered (Cell A ran with spec ON, same flags as baseline). The 12× ratio vs page cache is the main result. |
| First-request TTFT after boot · separate timer | +37 s | Almost entirely speculative-decoder warmup (deferred initialization that fires on the first served request, not during boot). Measured as smoke latency, not boot time. |
Two notes. First: speculative decoding shows up in two places. Its compile work is included in the 189.5 s baseline, and it gets re-triggered inside the +72.5 s Cell A delta when caches are wiped. The warmup is separate, paid on the first real request (+37 s TTFT). Second: I didn't isolate "pure disk-fetch time" with a dedicated timer. The clean storage number here is the +6 s page-cache delta. If you want a lower bound for disk IO inside the baseline, 41.6 GB at the observed 1.3-1.5 GB/s loader ceiling is ~28-32 s. That's a sanity check, not a measured attribution.
If you're trying to reduce inference cold-start, your biggest wins are compile cache persistence and engine config (specifically the speculative decoder; its boot tax is real and shows up twice, once in compile time and once in deferred TTFT). NVMe upgrades will move the smallest column.
The other default that turned out to be wrong: power
Once I stopped trusting the storage defaults, I ran the same check on the firmware power limit. The default wasn't optimized for this workload either.
With the engine already warm, I swept the per-GPU power cap from 350 W down to 200 W in 50 W steps using nvidia-smi -pl, running the same decode benchmark at each cap.
| Cap (per GPU) | Decode tok/s | Sum power (W) | Efficiency (tok/s ÷ W) |
|---|---|---|---|
| 350 W (PNY default) | 93.6 | 618 | 0.151 |
| 300 W | 92.7 | 594 | 0.156 |
| 250 W | 91.5 | 488 | 0.188 |
| 200 W | 83.2 | 397 | 0.210 |

The trade. Capping at 250 W instead of stock costs 2% of decode throughput and saves 21% of power. Efficiency improves 25%. Below 250 W you start losing real throughput; above 250 W you're paying for headroom you can't use on this workload.
Why it works: on Qwen 27B INT4 with TP=2, the workload is memory-bandwidth-bound on decode. The power cap squeezes core voltage and core clock, but the memory clock holds constant at 9.5 GHz across all caps. So you reduce power linearly while throughput is barely affected, until the cap drops below the point where core clock has to collapse (around 200 W on these cards) and decode finally starts to suffer.
I left both cards at 250 W on this homelab rig with a one-line systemd unit. The math is in my favor as long as I'm paying for electricity, which is to say always.
What an SRE should take away
- Bake the three cache dirs (
torch_inductor, Triton autotune, CUDA-JIT) directly into your container image. Rebuild on every driver / CUDA / Triton / vLLM version bump, since they're ABI-sensitive and invalidate silently. - Or mount as a persistent volume keyed on the runtime version triple; do not use
emptyDir(you'll lose the cache on every pod restart, which is the whole problem). - NVIDIA NIM and Modal both ship snapshot-based startup that's essentially this pattern, packaged as a service. If you're already using either, you're getting compile-cache persistence for free.
sudo nvidia-smi -pl <watts>) against your real decode workload, find the throughput plateau, pin the GPUs there with a systemd unit so it survives reboots. For RTX 3090s on this 27B-INT4 workload that's 250 W. For your hardware you have to measure: same parameter, same methodology, results in 10 minutes.
Caveats — what this isn't
- vLLM nightly (
0.20.1rc1.dev51, PyTorch 2.11, Triton 3.6, CUDA 13.0, driver 590.48.01). Other engines (TGI, TensorRT-LLM, llama.cpp) have different loader behavior and different compile profiles. - Two consumer GPUs on a desktop motherboard. Nothing here applies to NVLink/NVSwitch topologies, multi-tenant fleets, or anything that needs more than TP=2.
- NVMe Gen4 tier only. On NFS, S3 single-stream, or HDD-backed storage, the loader-throughput ceiling and page-cache contribution will both shift dramatically.
- One bench shape for the power-cap measurement. The curve will look different on prefill-dominant workloads (TTFT degrades faster than decode at low caps).
What's next
The companion piece goes deeper on the other half of the cold-start story: the speculative decoding compile-and-warmup tax, the 2×2 ablation that isolated it, why a 27B booted slower than a 72B on the same hardware, and how managed stacks (NIM, Bedrock, Vertex, Modal) handle the same constraints. If you found the compile-cache 12× ratio interesting, that's where the rest of the seconds live.